This tutorial focuses on real-time curves drawing. It shows how to modify tutorial-ibvs-4pts.cpp introduced in Tutorial: Image-based visual servo to draw the evolution of the visual features error and the camera velocity skew vector during an image-based visual servoing.
Note that all the material (source code and images) described in this tutorial is part of ViSP source code (in tutorial/visual-servoing/ibvs folder) and could be found in https://github.com/lagadic/visp/tree/master/tutorial/visual-servoing/ibvs.
The modified code also available in tutorial-ibvs-4pts-plotter.cpp is the following.
#include <visp3/core/vpConfig.h>
#include <visp3/gui/vpPlot.h>
#include <visp3/robot/vpSimulatorCamera.h>
#include <visp3/visual_features/vpFeatureBuilder.h>
#include <visp3/vs/vpServo.h>
int main()
{
#ifdef ENABLE_VISP_NAMESPACE
#endif
try {
for (unsigned int i = 0; i < 4; i++) {
}
robot.setSamplingTime(0.040);
robot.getPosition(wMc);
wMo = wMc * cMo;
#ifdef VISP_HAVE_DISPLAY
vpPlot plotter(2, 250 * 2, 500, 100, 200,
"Real time curves plotter");
plotter.setTitle(0, "Visual features error");
plotter.setTitle(1, "Camera velocities");
plotter.initGraph(0, 8);
plotter.initGraph(1, 6);
plotter.setLegend(0, 0, "x1");
plotter.setLegend(0, 1, "y1");
plotter.setLegend(0, 2, "x2");
plotter.setLegend(0, 3, "y2");
plotter.setLegend(0, 4, "x3");
plotter.setLegend(0, 5, "y3");
plotter.setLegend(0, 6, "x4");
plotter.setLegend(0, 7, "y4");
plotter.setLegend(1, 0, "v_x");
plotter.setLegend(1, 1, "v_y");
plotter.setLegend(1, 2, "v_z");
plotter.setLegend(1, 3, "w_x");
plotter.setLegend(1, 4, "w_y");
plotter.setLegend(1, 5, "w_z");
#endif
unsigned int iter = 0;
while (1) {
robot.getPosition(wMc);
for (unsigned int i = 0; i < 4; i++) {
}
#ifdef VISP_HAVE_DISPLAY
plotter.plot(1, iter, v);
#endif
if ((task.
getError()).sumSquare() < 0.0001)
break;
iter++;
}
std::cout << "Convergence in " << iter << " iterations" << std::endl;
#ifdef VISP_HAVE_DISPLAY
plotter.saveData(0, "error.dat");
plotter.saveData(1, "vc.dat");
#endif
}
std::cout << "Catch an exception: " << e << std::endl;
}
}
Implementation of column vector and the associated operations.
static bool getClick(const vpImage< unsigned char > &I, bool blocking=true)
error that can be emitted by ViSP classes.
static void create(vpFeaturePoint &s, const vpCameraParameters &cam, const vpImagePoint &t)
Class that defines a 2D point visual feature which is composed by two parameters that are the cartes...
void track(const vpHomogeneousMatrix &cMo)
Implementation of an homogeneous matrix and operations on such kind of matrices.
vpHomogeneousMatrix inverse() const
static double rad(double deg)
This class enables real time drawing of 2D or 3D graphics. An instance of the class open a window whi...
Class that defines a 3D point in the object frame and allows forward projection of a 3D point in the ...
void setWorldCoordinates(double oX, double oY, double oZ)
void setVelocity(const vpRobot::vpControlFrameType frame, const vpColVector &vel) VP_OVERRIDE
void setInteractionMatrixType(const vpServoIteractionMatrixType &interactionMatrixType, const vpServoInversionType &interactionMatrixInversion=PSEUDO_INVERSE)
void addFeature(vpBasicFeature &s_cur, vpBasicFeature &s_star, unsigned int select=vpBasicFeature::FEATURE_ALL)
void setServo(const vpServoType &servo_type)
vpColVector getError() const
vpColVector computeControlLaw()
Class that defines the simplest robot: a free flying camera.
VISP_EXPORT int wait(double t0, double t)
The last image of the drawing is the following:
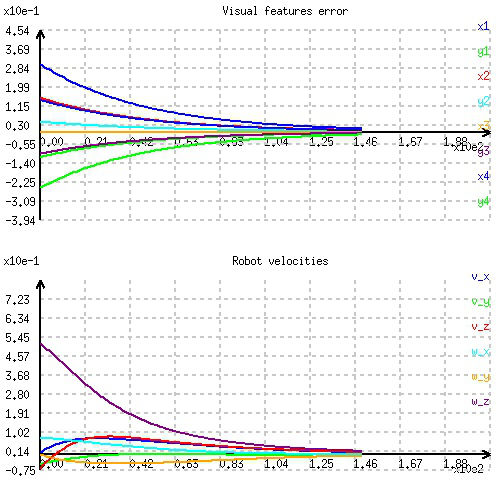
Last image produced by the plotter.
Now we describe the new lines that were introduced:
#include <visp3/core/vpPlot.h>
Include the header of the vpPlot class that allows curves drawing.
#ifdef VISP_HAVE_DISPLAY
vpPlot plotter(2, 250*2, 500, 100, 200, "Real time curves plotter");
Since the plotter opens a windows to display the graphics, the usage of vpPlot class is only possible if ViSP is build with a 3rd party that allows display capabilities; either libx11, GDI, OpenCV or GTK. If this is the case, we create an instance of the vpPlot class. The window that is created will contain two graphics. The windows size will be 500 by 500 pixels. The window position will be (100, 200), and the title "Real time curves plotter".
plotter.setTitle(0, "Visual features error");
plotter.setTitle(1, "Camera velocities");
To differentiate the graphics we associate a title to each of them. The first graphic (the one with index 0) will be designed to draw the evolution of the visual features error, while the second (index 1) will be designed to draw the camera velocities.
plotter.initGraph(0, 8);
plotter.initGraph(1, 6);
Here we initialize the first graphic to be able to plot 8 curves. We recall that we have 4 points, each point has 2 visual features (x and y), that is why there are 8 curves to plot. The second graphic is designed to plot 6 curves corresponding to the camera velocities (3 translation velocities in m/s and 3 rotation velocities in rad/s).
plotter.setLegend(0, 0, "x1");
plotter.setLegend(0, 1, "y1");
plotter.setLegend(0, 2, "x2");
plotter.setLegend(0, 3, "y2");
plotter.setLegend(0, 4, "x3");
plotter.setLegend(0, 5, "y3");
plotter.setLegend(0, 6, "x4");
plotter.setLegend(0, 7, "y4");
plotter.setLegend(1, 0, "v_x");
plotter.setLegend(1, 1, "v_y");
plotter.setLegend(1, 2, "v_z");
plotter.setLegend(1, 3, "w_x");
plotter.setLegend(1, 4, "w_y");
plotter.setLegend(1, 5, "w_z");
#endif
The previous lines allow to associate a legend to each curve.
#ifdef VISP_HAVE_DISPLAY
plotter.plot(0, iter, task.getError());
plotter.plot(1, iter, v);
#endif
Once the plotter is initialized, in the servo loop we add at each iteration the corresponding values of the visual features error 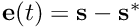 , and the camera velocities
  .
.
#ifdef VISP_HAVE_DISPLAY
plotter.saveData(0, "error.dat");
plotter.saveData(1, "vc.dat");
#endif
At the end of the servo loop, we save the data that were plotted in two separate files, one for each graphic. The first line of each text file is the graphic title. Then the coordinates along x,y and z are given in separated columns for each data.
Before exiting the program we wait for a human mouse click in the plotter window.