Introduction
ViSP allows to introduce trace and debug printings that may help debugging. To this end ViSP provides C or C++ macros that allows to print messages to the standard output std::cout or to std::cerr.
|----------|-------|-------------------------------------|---------------------------------------|
| output | type | std::cout | std::cerr |
|----------|-------|-------------------------------------|---------------------------------------|
|----------|-------|-------------------------------------|---------------------------------------|
|----------|-------|-------------------------------------|---------------------------------------|
Macros for trace
Macro for tracing vpTRACE(), vpTRACE(level), vpERROR_TRACE(), vpERROR_TRACE(level), vpIN_FCT() and vpOUT_FCT() work like printf with carrier return at the end of the string, while vpCTRACE() and vpCERROR() work like the C++ output streams std::cout and std::cerr. All these macro print messages only if VP_TRACE macro is defined.
Macros for debug
Macros for debug vpDEBUG_TRACE(level) and vpDERROR_TRACE(level) work like printf while vpCDEBUG(level) works like the C++ output stream std::cout. These macro print messages only if VP_DEBUG macro is defined and if the debug level is greater than the one defined in VP_DEBUG_MODE macro. Moreover vpDEBUG_ENABLE(level) can be used to check if a given debug level is active; vpDEBUG_ENABLE(level) is equal to 1 if the debug level is greater than the debug mode VP_DEBUG_MODE, 0 else.
Debug and trace usage in ViSP library
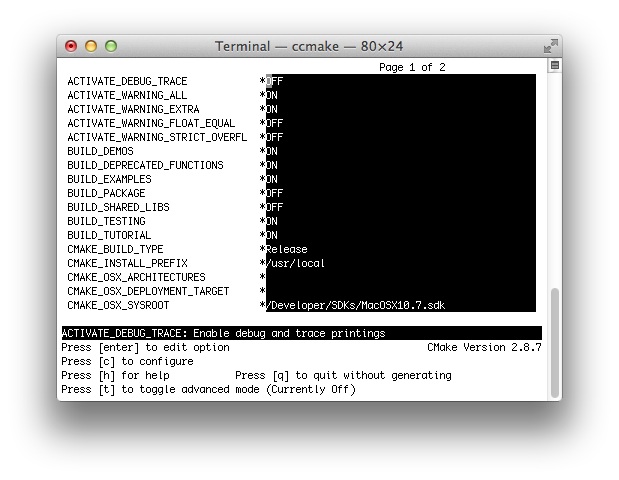
In ViSP, before an exception is thrown, trace macro are widely used to inform the user that an error occur. This is redundant, since the same trace message in generally associated to the exception that is thrown. Since ViSP 2.9.0, during CMake configuration it is possible to disable debug and trace printings by turning ACTIVATE_DEBUG_TRACE cmake variable to OFF.
- Using cmake command just run:
%cmake -DACTIVATE_DEBUG_TRACE=OFF <path to ViSP source code>
- or using ccmake GUI as shown in the next snapshot:
- Note
- When
ACTIVATE_DEBUG_TRACE is turned to ON (this is the default behavior in ViSP), we simply define VP_TRACE and VP_DEBUG macro using the compiler -D option.
Debug and trace usage in your own project
If you develop a project that uses ViSP library as a 3rd party, there are different ways to benefit from debug and trace macro described previously.
- If ViSP was build with debug and trace enabled using
cmake ACTIVATE_DEBUG_TRACE=ON, debug and trace are also enabled in your development.
- If debug and trace were disabled in ViSP (
ACTIVATE_DEBUG_TRACE=OFF), you can enable debug and trace in your own development either by defining VP_DEBUG and/or VP_TRACE macro in your code using #define VP_TRACE
#define VP_DEBUG
#include <visp/vpDebug.h>
CMakeLists.txt file by adding an option as in ViSP: option(ACTIVATE_DEBUG_TRACE "Enable debug and trace printings" ON)
if(ACTIVATE_DEBUG_TRACE)
add_definitions("-DVP_DEBUG -DVP_TRACE")
endif()
The following example also available in tutorial-trace.cpp shows how to use the previous macro.
4 #define VP_DEBUG_MODE 2 // Activate debug level 1 and 2
6 #include <visp/vpDebug.h>
13 std::cout <<
"Debug level 1 active: " <<
vpDEBUG_ENABLE(1) << std::endl;
14 std::cout <<
"Debug level 2 active: " <<
vpDEBUG_ENABLE(2) << std::endl;
15 std::cout <<
"Debug level 3 active: " <<
vpDEBUG_ENABLE(3) << std::endl;
19 vpTRACE(1,
"C-like trace level 1");
32 vpCTRACE <<
"C++-like trace" << std::endl;
33 vpCERROR <<
"C++-like error trace" << std::endl;
36 vpCDEBUG(2) <<
"C++-like debug trace level 2" << std::endl;
#define vpDEBUG_ENABLE(level)
When ViSP library was built without debug and trace the previous example produces the output:
%./tutorial-trace
Debug level 1 active: 0
Debug level 2 active: 0
Debug level 3 active: 0
When ViSP is rather build with debug and trace the previous example produces the output:
%./tutorial-trace
(L0) begin /tmp/tutorial-trace.cpp: main(#9) : main()
Debug level 1 active: 1
Debug level 2 active: 1
Debug level 3 active: 0
(L0) /tmp/tutorial-trace.cpp: main(#17) : C-like trace
(L1) /tmp/tutorial-trace.cpp: main(#18) : C-like trace level 1
(L0) !! /tmp/tutorial-trace.cpp: main(#20) : C-like error trace
(L1) !! /tmp/tutorial-trace.cpp: main(#21) : C-like error trace level 1
(L0) /tmp/tutorial-trace.cpp: main(#24) : C-like debug trace
(L0) !! /tmp/tutorial-trace.cpp: main(#25) : C-like error trace
(L2) /tmp/tutorial-trace.cpp: main(#27) : C-like debug trace level 2
(L2) !! /tmp/tutorial-trace.cpp: main(#28) : C-like error trace level 2
(L0) /tmp/tutorial-trace.cpp: main(#31) : C++-like trace
(L0) !! /tmp/tutorial-trace.cpp: main(#32) : C++-like error trace
(L2) /tmp/tutorial-trace.cpp: main(#35) : C++-like debug trace level 2
(L0) end /tmp/tutorial-trace.cpp: main(#37) : main()
In the previous printings:
- the number after "L" indicates the debug or trace level; example (L2) is for level 2.
- the number after "#" indicates the line of the code that produce the printing; example main(#37) means in function main() at line 37.
- the "!!" indicate that the printing is on std::cerr. Others are on std::cout.


